The horizontal geometry band displays no values until the alignment is promoted. Breaking the reference to our alignment, which is not a suitable workaround IMO as we have too many profile views, alignments that would need to be recreated if something changes…
We really need a proper fix for this ASAP.
Before no values displayed
After, promoting the alignment, removing the band and re-adding ,the values now display.. (not a suitable workaround!)
UPDATE: Autodesk is aware of this issue and can reproduce the problem CaseNo:10466148, This only happens when you ahve your properties palette open.
This is a difficult one to explain. So I have made a screencast to show you here
But basically when selecting something that is a civil 3d object with a “Left-Right” or “right-left” selection and you drag your mouse outside the autocad window (say the start menu). Autocad no longer is the current program. Requiring the user to select the autocad icon on start menu. Or click on the top bar to regain focus..
Very frustrating as my commands often have to be done twice as a result. OR more often then not a complicated selection during a command that may have taken a little while is lost.
Additionally once this has occurred once. A left-right selection on the object without even dragging outside will continue to allow the program to lose focus!
See example file and explanation below so you can recreate problem for yourselves.
Your point/link/shape codes are critical for display purposes in section views etc. Effective code set styles can’t be setup if you have not coded your assembly. But you also need them to be able to generate surfaces, use quantity take off features and generate material take off reports.
If your not sure about point/link/shape codes, read the article here
So you want them to be easy to change, but hard to make a mess on the users side. For this reason, I suggest using the “sandwich” technique. Where every code utilizes the material code (the meat/salad) and has a prefix and a suffix (the bread)
The Prefix Is generally used for staging/options and for intersection design subassemblies. This allows the user to quickly use the same subassembly twice, but not have the codes muddled because they are the same. So you could put OP1 (option 1) in front of all the codes. Then make an exactly copy of the subassembly change some of the parameters and change the code prefix to OP2 (option 2) and so on. This is a fantastic technique for generating multiple options in the one corridor!
User can specify the prefix for the subassemblyThis prefix gets populated to all the codes! Rather than typing them one by one!
The suffix Is used to denote the components of the subassembly. So DL = Daylight Point, CR = Crest Point, Top = Top Links. These are all common between the materials.
The Result Is you end up getting a logical list like so
OP1_A_CR – point code
OP1_A_DL
OP1_A_Top – link code
OP1_A_Bot
OP1_B_CR
OP1_B_DL
Etc. etc.
Which makes life very easy
Setting up in Subassembly Composer 1. Start every CS by adding in these two flow charts first
– Variables will contain parameters that are common throughout the CS. So things like “Delta X for Layout” or “Depth for Layout”, the length used to display surface links on you’re assembly
– Codes will be used to create all the ‘sandwiches” you need to code your subassembly effectively.
2. Double click the Variables Flow chart and begin by creating a zDFL as per below
Rather than typing the default value as 20, you could link this to an input parameter. Which means the user could control the “depth for layout” or how high the section looks when you attach it to an assembly in C3D.
3. Now go into the Codes Chart, in here we are going to create all the code pairs “sandwiches” that we will need. Lets consider Material D.
In material D we will have two surfaces (orange and red) that can be created. Top and Bottom (from 4 links), 4 Feature lines and 1 Shape Code, So:
Points OP1_D_DL x 2 (its important to have only 2 feature lines created at either edge of a series of links, this way boundaries can be specified automatically)
OP1_D_CR x 2
Links OP1_D_Top
OP1_D_Bot
Shape Codes
OP1_D (no need for suffixes here as we only have one material)
Shared Links and Points Of course some of our links will share links with another material, like C and D and E and D, likewise with points. So how do we handle this confusion?
By systematically going through the materials we can create the variables quite quickly. You could do this by typing into each link/point. But I prefer to sort it all out in the codes flowchart then link the result back to the link/points at the end.
Starting with Material D you can define variables (you can start with A if you want!
Then systematically working through by material you will eventually have all these parameters you can call rather quickly. Making it a lot easier to code, as well as understand for the end user of the CS.
Go through and create the rest. then move on to %Lesson 5%
This is the free option for those of you looking to get some public imagery into cad. Although I imagine if you are using Civil 3D 2015 with the new bing maps functionality. This method is a little defunct. If your using Vanilla Autocad you will need to download the GEOREFIMG lisp from CAD Studio to import
Feeling Lazy… Watch the video
QGIS or Quantum GIS has much more functionality than just saving Aerial Imagery. It’s a very comprehensive and powerful free GIS tool that should be in every designers arsenal.
1. Next open up QGIS from the desktop shortcut (im using 2.8.3 Wien when writing this)
2. Go to Plugins – > Manage and Install Plugins
3. Search for the OpenLayers Plugin and Install
4. Next we need some data to quickly get your location correct. Export either a 2007 DXF or MAPEXPORT a SHP file that contains some line work of your area that’s in a known coordinate system.
5. You can either drag drop it into QGIS or just press the “Import Vector Data button”
6. QGIS should prompt you for a coordinate system for your data. If it doesnt, right Click on the layer in the layers window on the left and select “Set Layer CRS”
7. Im in Australia so I select MGA zone 56. QGIS’s coordinate system library is incredibly comprehensive so you shouldn’t have any problems finding yours here.
8. Now the imagery, go to Web -> OpenLayers plugin -> pick a imagery source. Google/Bing/Yahoo/OSM/Apple street and aerial/hybrid sources are available
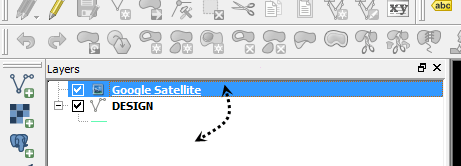
9. You should now have imagery in. You might need to change the draw order to check that your line work matches up, drag drop them so that your line work is on top.
Imagery in
10. Now just get your viewport to the imagery extents you want, then turn off the linework. The image will save whatever you are looking at, in whatever coordinate system you have specified for the project.
The resolution will be what you see is what you get (WYSIWYG) so if you want a better resolution you will need to save multiple images at a closer view. See my post here on how to do that, or watch the video above.
11. Now save your image. Go to Project -> “Save As Image” and call it “Google-PSY” the PSY indicates it is in the WGS84 Pseudo Mercator Coordinate system.
12. We now need to read the saved image back in and convert it to the correct coordinate system been – MGA zone 55. Using the Warp (Reproject) from the Raster-> Projections menu.
13. Specify the “Google-PSY.png” we saved, choose the output file, Make sure you specify the source coordinate system (WGS84 – Psuedo Mercator) and the target coord system (mine is MGA zone 55)
14. Export it as a “Geotiff” and call it Google-MGA55 or whatever your coordinate system is. The Geotiff format will contain all the georeferencing information inside the file.
15. Now just use MAPIINSERT command (GEOREFIMG lisp for vanilla cad users) to import into CAD. Pow! Imagery. This also works well for stitching bits of imagery together.
If you not using any dynamic referencing for your materials. or having problems managing repeating items in your drawings. Read on
See the screen shot below of my sheet views list from one of the jobs I am working on.
Whenever you have a bunch of materials been called out. Unit 1,2 etc… I have been using sheetviews to link them back to my drawings. Saves a whole bunch of time when it comes to fixing it all up later!
All I do is create an empty layout view under the category “materials”.
I also posted a screen shot to show you how much of the drawing can be controlled from this magical little list.
All you need is a Sheet Set… and comment below if you want to know more
UPDATE: Although I still recommend creating legends in model space of xref’s, this process really needs to be reviewed. As creating excess view ports in PSPACE can slow a drawing down significantly. Update should come soon.
We all create legends and keys regularly throughout our drawings. However creating them and managing them as we work proves difficult and cumbersome. I have a simple method I have been using for years that I notice regularly is not in use.
The secret is quite simple.
Place your legends in each xref!
Then simply viewport onto each in each layout as required.
If you are like many other civil drafters and create many xrefs to separate different data types, then you will find this tip exceptionally straight forward and obvious. Hell, you may already do it!
If you don’t work with xrefs in this manner then I suggest its time to change, however you can still employ the same technique.
I’ll explain some of the intricacies below.
What do you expect from legends?
I want my legends to:-
Be dynamic and update as I change each viewports layer settings in layout space.
Be dynamic as I make changes to layers in the xref
Get scaling correct on hatches and linetypes.
Be able to update legends on multiple drawings at once.
Be able to leave some items off legends or mismatch items.
All of this is possible using this technique.
How it all works
Inside the xref you only create each component and its label for the xref in model space off to the side (I typically go right side). Like below.
Step 1 – Add each component to a dummy legend in your xref
Ensure you create the legend at the scale you intend to viewport onto it with. ( i always create legends at 1:1000)
Ensure that all the objects you have on your legend are on the same layer and are the same linetype scale as your data in the xref. If you have annotative objects like hatches make sure you have added the legend scale you intend to use.
Step 2 – Allow space and stack straight
If you have more xrefs that have data that needs to be on the legend. Make sure you don’t put it in the same place as your other xrefs. I xref in other drawings that have legends already and continue to make a big panel that runs up and down in model space. This makes it easier in each layout to construct my legend with viewports.
Then last of all xref in the data, if you haven’t already, and place a viewport at the scale you chose on your legend. If you want multiple items just create more viewports! Ensure you place the viewport with space to expand down and across. The legend below has legends from 3 (three) different xref’s. With the exception of the existing boreholes I have allowed room for the testing and geophysics items to move up and down accordingly.
Step 3 – Place viewports onto each xref’s legend component.
ensure you allow space to move.
If you change the colour on a layer in that particular drawing, the legend updates accordingly. If you have this same legend on multiple drawings and make a change in the xref, obviously it updates on all drawings. If you add a few items or so, they are all updated on each drawing and you do not need to go into the drawing.
A completely simple time saving technique that makes legends in Autocad extremely easy to create and manage. Give it a try some time!
Civil 3D news/tips/tricks from someone like you and also some Unity Game Development stuff