Although its useful to be able to superimpose profiles between profile views. It would also be useful to be able to show crossing objects as well. With a similar screen to the one for sections.
Be great if alignments/profiles was also an option In here as well!
We all get these from time to time. Unfortunately Civil 3D is rather vague about what is causing this error.
or
^^^^ I HATE YOU ^^^^^
I can tell you empirically that the primary cause almost 99% of the time is a boundary that has been added to a surface somewhere along the chain that needs to be cleaned up.
A few people will suggest using things like MAPCLEAN and WEEDFEATURES to fix over complicated boundaries lines and breaklines and these methods do help. But they don’t always work.
A great method for fix this is to use the OVERKILL command. It will remove overlapping segments that are duplicates within a polygon. Commonly this comes from output from other software!
If you still have no luck try a method that I have used for years. Simply “STEPPEDOFFSET it out and then STEPPEDOFFSET it back in” maybe 0.5m or so.. (note: occasionally you may need to offset it back in 1 mm different, so back in 0.499m)
I have over exaggerated this to explain the issue, but here is what an offset does to a messy line with overlaps and duplicate vertices
Just whatever you do, don’t go extracting the triangles and re-adding them to a surface!!!!
I started writing this, realised it was getting incredibly long and stopped…
There is a distinct problem with “scalability” in Civil 3D. As modelling becomes more complex, as inevitably it does, handling of batch operations and multiple objects is hindered significantly by a lack of simple functionality to handle them in the core product. In turn, precious hours are wasted.
I am very interested to hear what can be done on the development side to deal with this problem? The changes for some of these items seem rather simple..
See below examples….
This is just a small handful of things you have to do “one at a time” inside Civil 3D. A simple function added would allow you to do multiple operations at once, saving an operator hours of time! But yet, we have to live with it!
(Having 20 plugins and/or 3rd party apps to deal with this is not a solution!)
1. Create Reference using Data shortcuts. You can create multiple data shortcuts, but you can’t “Create Reference” to multiple data shortcuts.
2. The volume dashboard can add multiple surfaces at once. But only remove one at time. Not to mention its lack of sorting or basic organisation functionality like, the ability to change multiple surface styles at once.
3. Synchronizing Data Shortcuts can only be done on mass. Or one at a time. It would be ideal to be able to choose the objects I wish to synchronize in the toolspace to save processing time.
4. Additionally while synchronizing there is no way to specify in the “Object Name Change” box to update the name of all change objects
5. Settings Objects to rebuild automatically. Currently you can only turn them on/off one at a time. Very time consuming. There is a lot of work that can be done here. Particular for more complex models that need to be changed. Rebuilding can take a very long time and you may want to delay it until you have made enough changes.
a. Adding a “Global Rebuild” On/Off Feature. This would allow a quick and dirty solution to changing complex models without the wait time..
b. Adding the ability to turn on/off rebuild for civil 3d objects in the prospector/properties box. And even “save rebuild state” so you can restore certain states for particular modelling operations.
6. In the Profile View Properties – > Profiles Screen although you can select and edit multiple profile styles etc. You cannot add or remove profiles
7. Additionally in the “Create Surface Profile screen” Only one alignment can be given profiles at a time.. Plus profiles that were previously created can’t be removed?
8. Corridor Targets – You can only do them all or one at a time. It would also be particularly useful to “copy/paste” targets between items.
9. “Set Width or Offset Target” and the “Set Elevation Slope Target” – In more complex drawings your alignment list can get quite long. A tick box that filters out “alignments/profiles that aren’t related to this corridor” would be very useful. Not having to press the “add” button everytime and just pressing enter would be also quite useful.
10. Can only add one DEM file to Surfaces at a time.
But you can do it in the point cloud creator?
In my opinion the GUI functionality is inconsistent and broken and needs a major overhaul. Relying on third party developers to solve these problems by creating little apps that perform these operations is also not good enough. Quite often the API is not available for these functions.
I do hope that good apps that reflect “core functionality” should be bought or reproduced and incorporated into the product regularly. Not left to be discovered on an “as needed basis”
It is quite easy to do perform a stage storage analysis of a simple basin or dam water. This is because all the volumes are compared to a flat elevation, one flat surface (water level), one irregular surface(ground surface).
But what if you want to know the stage storage elevation of a dam wall or a stockpile, i.e two irregular surfaces).
Well you can essentially use the same technique as described here, but you will need to compare the two stage storage analysis’s to get the final answer.
By turning our two irregular surfaces into two separate stage storage calculations to a common flat surface, we can then subtract one from the other to form a stage storage of the stockpile.
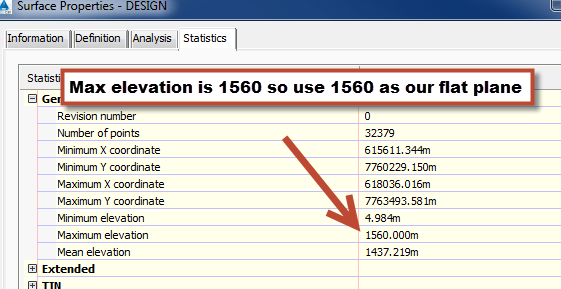
Firstly we need to create the common flat surface, the best technique is to find the Max RL of the design surface, by looking at the Surface Properties.
On this stockpile the max RL is 1560 . So, I’m going to create a flat plane at 1560 m and add it to a new surface called “CALC LEVEL”
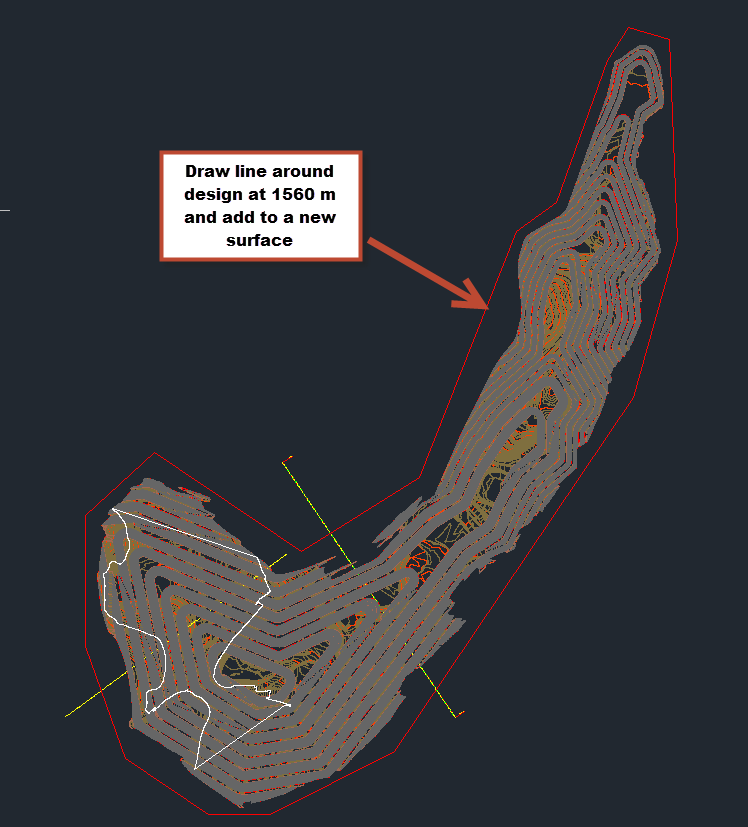
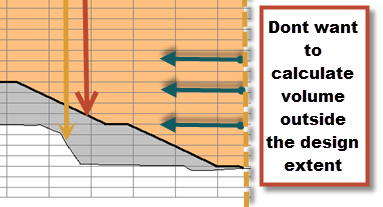
Now we need to limit our calculation to the design extent
So you will need to create a surface that clips the existing ground to the design surface boundary.
Now you have all the surfaces you need, you can create the two volume surfaces to do the stage storage,
one that compares to the design, – The Subtract Surface
and another that compares to the existing ground – The Addition Surface
Extract the stage storages for both of them using the technique described in my post here
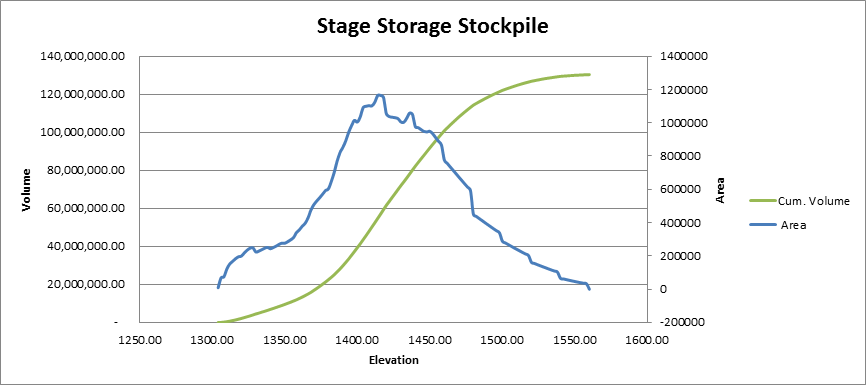
You will now need to do a simple subtraction between the two stage storages to form a combined stage storage like below.
The finished result it is quite clear. Looking at the area it starts narrow at the bottom, increases to full width where the toe meets the ground, then reduces in size as it goes back down to the crest of the stockpile. The change in volume also reflects with the increase in area.
Do a final check with a volume surface at the end to see if your correct.
I wish custom sub assemblies could be kept within the drawing. Or at least provide a clear warning to users that “the following custom sub assemblies could not be found”when opening a DWG!
If you really want to make the most out of your WordPress Blog an absolute–must-first-thing-to-do is setup “Post-By-Email”
“Post-By-Email” allows you to write a basic email, add pictures etc. and then post directly to your blog using a special email address. Then you can go online and tart-up your post and add tags etc. later. But at least most of the hardwork is done in a familiar environment.
Here is how to set it up.
Login to your blog on the backend. Then go to your profile
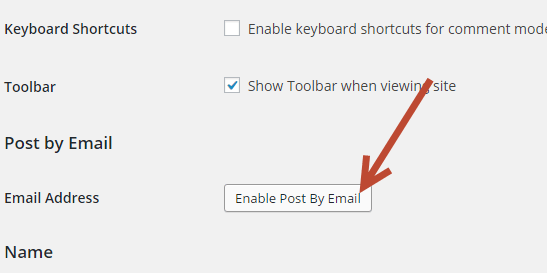
Find the “Post by Email” section and click “enable Post By Email”
After you click it will give you a unique email address you can add as a contact in email.
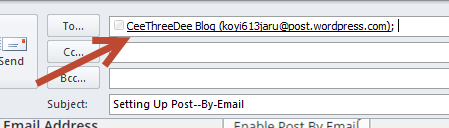
Simply add a contact in your address book
Write an email, address it to the contact and post away. Couldn’t be easier..
I have been having some serious performance issues lately with my DELL precision M6600, which is almost 5-6 years old now!
I finally found a way to determine if it is my hardware or my workflows. Quite pleased to say it was my hardware and I am not crazy. But here is how I found out!
Download the Passmark Perfomance Test tool from link below (Free 30 day trial). These guys test over 600 000 rigs or something like that daily and after you complete your test you can compare your results to people with a similar or identical rig. Very useful!
1. After you load into the performance tool, go the system tab and take note of the key specs of your computer. You will need these to find other rigs similar to yours to compare to.
CPU type/speed/L3 cache
Total Physical Memory
HDD Rpm/Size
Video Adapter Description
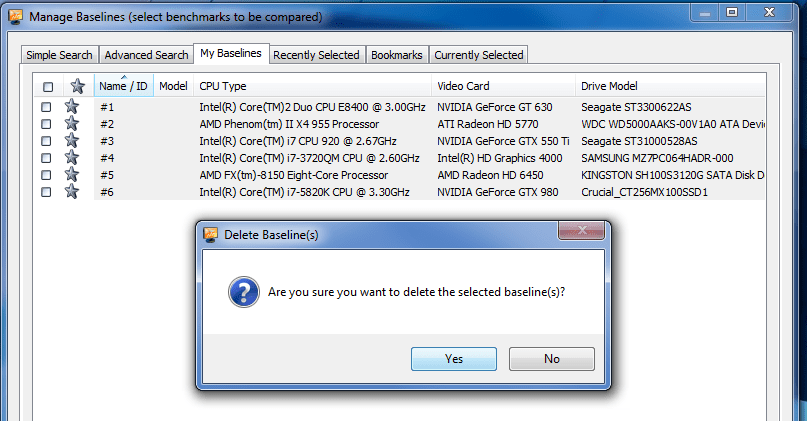
2. Go to “Baseline” Menu -> Manage baselines…
3. Now go the “My baselines” tab and delete all the existing baselines that get placed in by default
4. Then go to the “advanced search” tab and add in a few params. I added my cpu and clock speed and my model type
5. Tick on as many baselines as you can see match your specs. You may need to play around with the search params. You can add up to 16 baselines.
6. Now run the Benchmark! Make sure you close any working applications. If your on a laptop, make sure you plug your power supply in.
7. You will get a nice little bar and some popups while it runs.. Even a jet flying around..
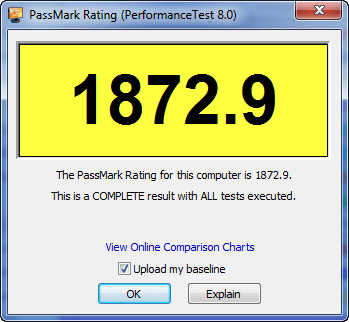
8. When your done you will get a score like so.
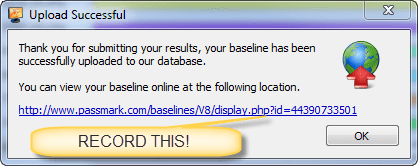
9. After you finish uploading you will get a popup with a link .. RECORD THIS LINK, As I haven’t been able to find it later! And its useful to be able to send to others etc..
10. You can now see how your computer benchmarks against other rigs with similar hardware. I ran this test on an old desktop I found to replace my laptop. My laptops results are further below… Absolutely woeful!
Every now and then we find ourselves in a pinch for data. I don’t know how many times I have had nothing but a PDF to go on..
Well, it appears that a PDF is lot more useful than I first thought. Particular If it’s a vector PDF, you can usually tell if it is by zooming in and out on the PDF and you will see all the linework generate separately.
I won’t lie, I haven’t found a free tool to do this yet. But over at DOTSOFT Tools an application called PDF2DWG http://www.dotsoft.com/pdf2dwg.htm for 95 US sheets does get the job done very nicely.
I’ve actually bought the entire toolpac package that comes with PDF2DWG ($245), good value if you ask me. You can find the tool in the ribbon after installing, along with a host of other useful ones.
Select a PDF, even a multipage one
Lots of options here as well. Detect line weights, removing little raster images (particularly use for PDFS generated by GIS programs) and even the ability to convert image-based pdfs to linework (can’t verify how well this works though)
Hit process and voila! Massive time saver, that can pull you out of a “not enough data” situation very quickly.
Once you have a relatively established blog. Hopefully you will start having some posts become more popular than others. I’m sure they are all great! To you anyway.. :p
I really like the idea of people been confronted with other potentially useful posts. So a content widget showing most popular posts works great. If you have a self hosted wordpress blog like mine. Then you should definitely check out the Jetpack Post Views widget. Although not very customizable. It does get the job done quick.
Jetpack Post Views WidgetLive Jetpack Post Views Widget
Alternatively, you can use the W4 Post List plugin that allows you to create a fully customizable look with some CSS. In my case I wanted to thumbnail to be larger!
One very important secret is in the using the
jetpack-post-views
meta key to sort your posts by view count! Wow, took me a while to find that one!
use the jetpack-post-views meta key to get them sorting nicely.
Then its just a matter of inserting the widget
W4 Post List – Widget
And Voila! Looks a lot nicer and you can make it look like whatever you want.
2. Extract the archive to some location e.g. Desktop
3. Add your pdf to the “bin” folder of the extracted archive/folder structure.
4. Open command prompt. Easiest way is to right click on the bin folder while holding shift. There will be an option in the context menu “Opencommand window here”.
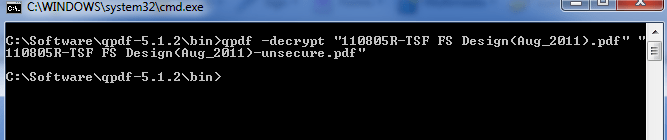
5. Type the following in the command window (black screen): qpdf -decrypt “Secured.pdf” “Unsecured.pdf” where “Secured.pdf” is the name of your file that you want to unsecure. Note the quotes are required. “Unsecured.pdf” is the name of the output file. Call it what you want.
Write this as a bat file in notepad and you can do hundreds of PDFS
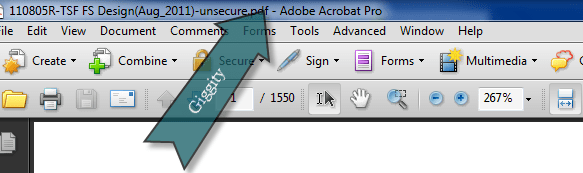
Note: For both of these methods If the PDF requires a password to OPEN the file this will not work. All other typical security is removed e.g. making changes, copying content etc
Civil 3D news/tips/tricks from someone like you and also some Unity Game Development stuff